The VisualRepbase interface has three main components:
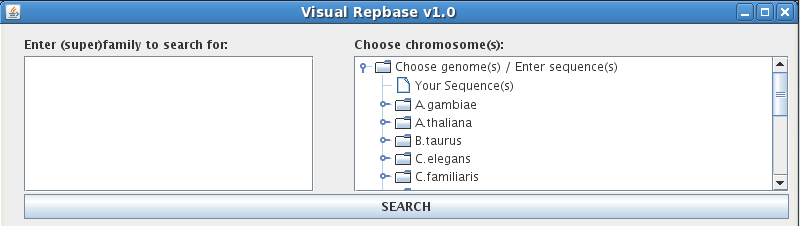
The VisualRepbase Search finds occurrences of transposable elements, or TE's, in given genomes/sequences. Performing a search requires entering information in two fields:
"Enter (super)family to search for:"
Use the text box in the upper left corner to search for a family or superfamily name. You can enter up to twenty family names per search, typing in one name per line. If you do not know the exact name of the family or superfamily you are looking for, use the asterisk symbol (*) to match zero or more unknown characters. For example, typing "ATREP*3" will return any family names that begin with "ATREP" and end with "3": "ATREP3" and "ATREP13".
"Choose chromosome(s):"
The navigation tree on the upper right is used to select chromosomes from the VisualRebase database. To begin, click on the folder icon next to "Choose genomes(s)/Enter sequences(s)". This opens up a complete list of genomes included in the VisualRepbase database, and an icon for "Your sequence(s)" will appear at the top of the list. VisualRepbase displays only those genomes that are completely sequenced and annotated. To perform a search, you must choose one or more chromosomes in one or more genomes. Clicking on a given genome displays a list of all of its chromosomes, and the word "All" appears at the top of the list. Click on a chromosome to select it, or use CTRL or SHIFT to select multiple chromosomes at once; use "All" to select all the chromosomes for a particular genome. Selected chromosomes will be highlighted by a gray box.
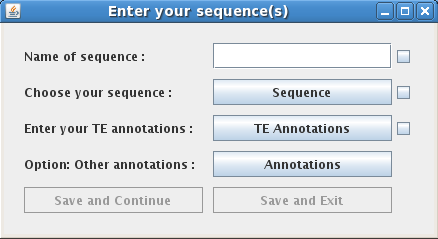
To enter a new sequence with annotations into the database, click on the icon next to "Your Sequence(s)". This will open a new window that allows you to enter information about your own sequence. Begin by typing the sequence name into the text-entry box. Below the text-entry box there are three drop-down buttons:
Examples of each of the required file formats can be found here: Sequence, Annotation of transposable element, and Annotation of genome.
After selecting your chromosome(s) and entering the TE family name(s), click on the "SEARCH" button.
II. Results Display
The Results Display is the primary interface for visualizing occurrences within a given genome/chromosome and comprises three visualization tools:
"Graphical result:"
Before you start a TE search, the Graphical result window shows a blank line drawn in a 5'-3' orientation; this is the "virtual chromosome". The numerical scale at the bottom indicates position on the chromosome. Below this window there are three buttons that allow the user to adjust the zoom/view. By default, each unit represents 10,000 bp and the larger graduations represent 100,000 bp. Clicking on "Zoom in" doubles the size of the graph and correspondingly decreases the unit size to 5,000 bp. The highest zoom possible is 1 unit = 100 bp. Similarly, the "Zoom out" button successively decreases the size of the graph until it reaches the furthest zoom limit, 1 unit = 160,000 bp. "Global view" scales the width of the graph until the largest selected chromosome is contained in the graphical window.
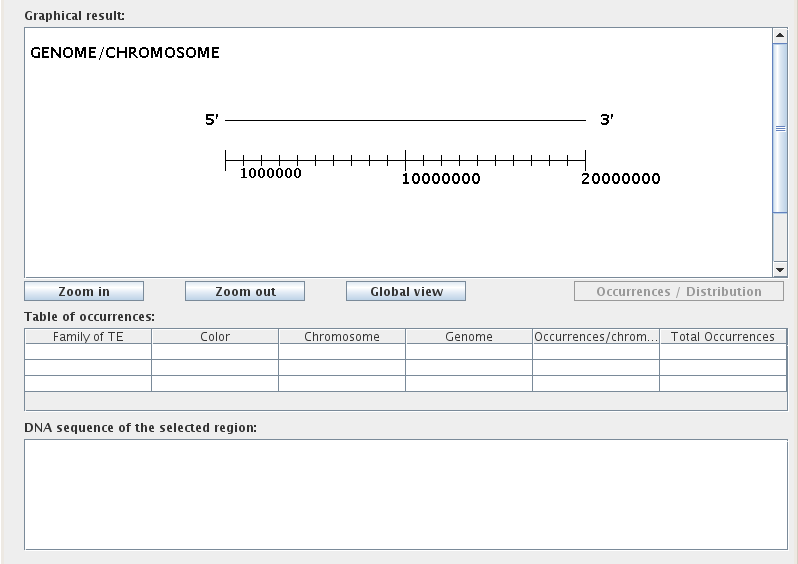
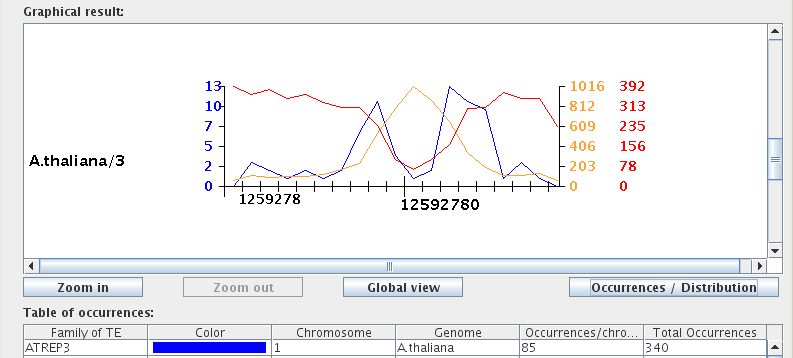
After performing a TE search, you can toggle the graphical mode using the "Occurrences/Distribution" button, located to the right of the zoom buttons below the Graphical result window. The Occurrences mode is used to assess the location, size, and biological environment of occurrences, while the Distribution mode quantifies the distribution of occurrences for each selected chromosome in a line graph format.
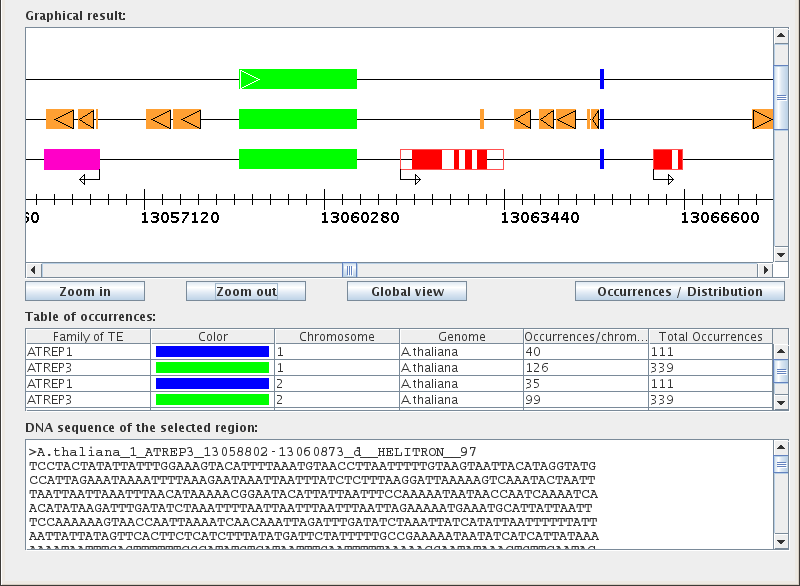
"Table of occurrences:"
The Table of occurrences is split into six columns: "Family of TE", "Color", "Chromosome", "Genome", "Occurrences/chromosome", and "Total Occurrences". Each table row corresponds to a single transposable element family for a given chromosome. For example, searching for two TE families within three chromosomes would result in a table with six rows. Note that when saving the Table of occurrences to Excel format, the "Color" column will not be included.
"DNA sequence of the selected region:"
The lower text field displays DNA sequences for biological items selected from the graphical results window. To see the DNA sequence for a particular biological element, simply click on the colored icon representing that element in the graphical results window.
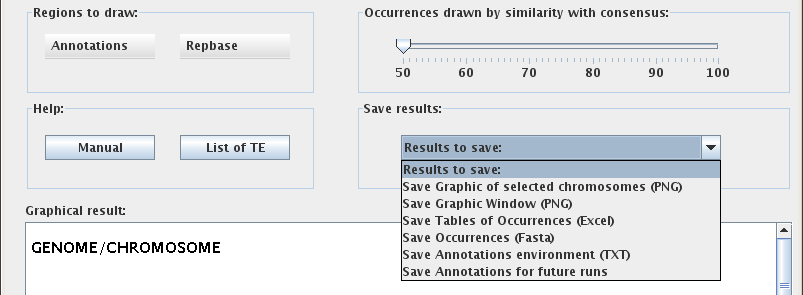
There are four Options panels that allow the user to control the Results Display and to Save their results:
Together, the first two Options panels control the Results Display. These options can be adjusted dynamically at any time while the interface is running and changes will be reflected in real time.
"Regions to draw:"
This panel provides options for displaying or hiding various chromosome annotations through two drop-down menus:
If NO Annotations and NO Repbase options are selected, only one line will be used to display the occurrence of transposable elements for each chromosome in the graphical window. If either Annotations OR Repbase are turned on, the software will use a second line to display the respective biological occurrences for each chromosome. If BOTH Annotations and Repbase options are turned on, the software will use three lines to display all selected occurrences for each chromosome in the graphical window. Specifically, Repbase annotations will appear on the second line and gene annotations will be on the third line.
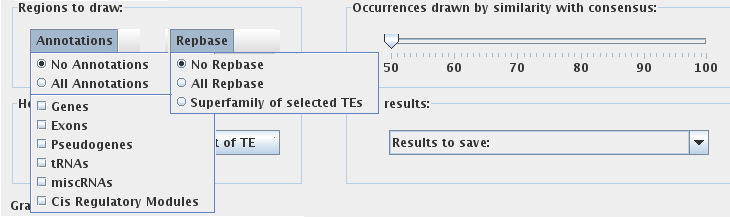
"Occurrences drawn by similarity with consensus:"
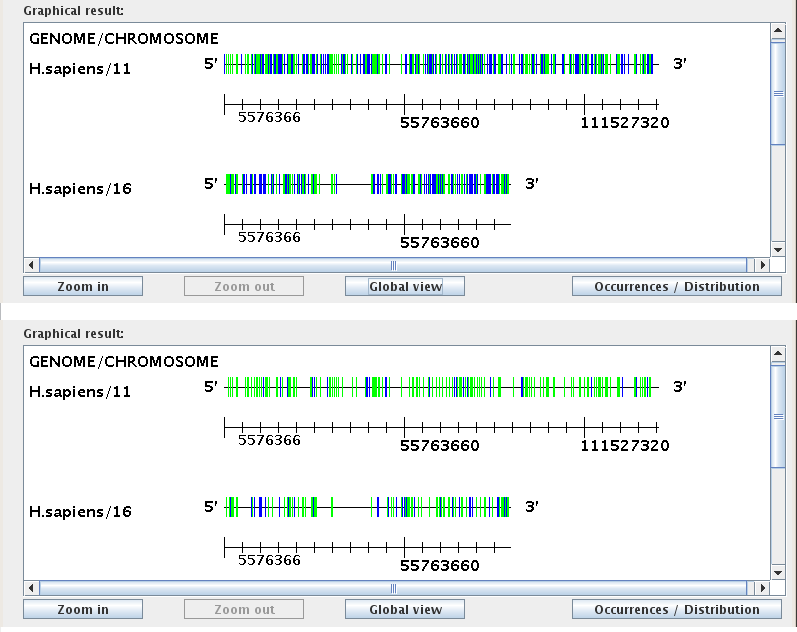
The Similarity-to-consensus slider bar on the right controls the display of occurrences based on their similarity score. The similarity score is calculated by CENSOR as a percentage of identity to the family consensus sequence. The default setting for the slider bar is 50%; in this setting all occurrences of selected transposable elements will be drawn. When the value of the slider bar is adjusted, the graphical window will display only those occurrences that have a similarity score GREATER THAN OR EQUAL TO the threshold similarity score, omitting any occurrences that fall below that score. Changes will automatically be reflected in both the Occurrences and the Distribution modes of the Graphical result window. The figure below demonstrates how these settings affect the discernable frequency of occurrence for two transposable element families. In the first scenario the value of the slider bar is set to the default 50%, and in the second scenario the value is set to 75%.
"Save Results:"
To save your results, use the "Results to Save" drop-down menu to first choose an output format. This will open a new window where you can name the file and choose a directory to save to.
The "Save Annotations for future runs" option saves the annotations of genes, exons, introns and non-coding regions for each selected chromosome. The results will be saved as a text file called "Annot_G_C.vrb", where G is the name of genome and C the name of the chromosome, and will be saved to the same directory as VisualRepbase. The next time the user opens VisualRepbase with the same chromosome(s) selected, the program will use information from this file instead of the database, improving processing speed.
"Help:"
The Help panel has two options:
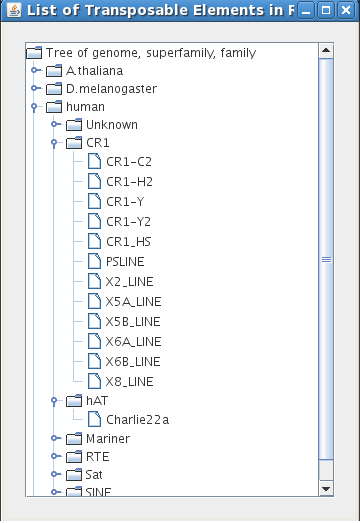
The "List of TE" button is useful if you do not know the name of a particular transposable element or want to study a new element in Repbase. Click through the nodes of the tree to open up lists of elements contained in each node. Clicking on the name of a transposable element family adds that family to the list of transposable elements you can use in your search.